Have you run your firmware, found a repeatable bug, but weren’t able to reproduce the issue when single stepping through the code with your debugger? Maybe your internal watchdog block times out, resetting the system, and you have no idea why.
Firmware programmers often must deal with difficult bugs late in a product cycle. Fixing simpler bugs can often reveal more complex bugs underneath that need to be fixed before the product ships.
Instruction tracing is one powerful tool that can speed up debugging, especially for bugs involving complex firmware interactions. Many ARM processors, such as the Cortex-M in conjunction with the SEGGER J-Trace probe, allow instruction tracing with a minimal number of external pins. The J-Trace probe also contains a built-in license for the SEGGER Ozone debugger.
Advantages to Instruction Tracing
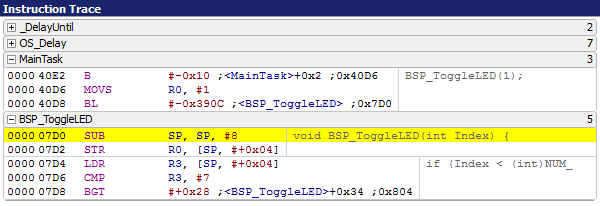
1. Ability to debug complex code interactions that are covered up by single-step debugging. Trace captures code sequences, including all interrupts and context switches. This temporal observability provides significant reduction in debug time
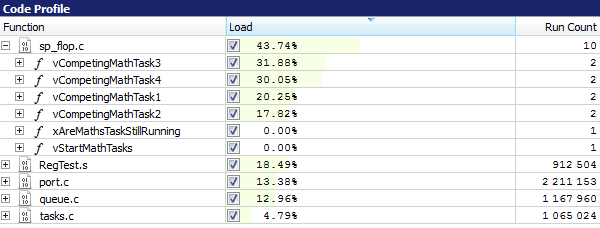
2. Zero-overhead function profiling
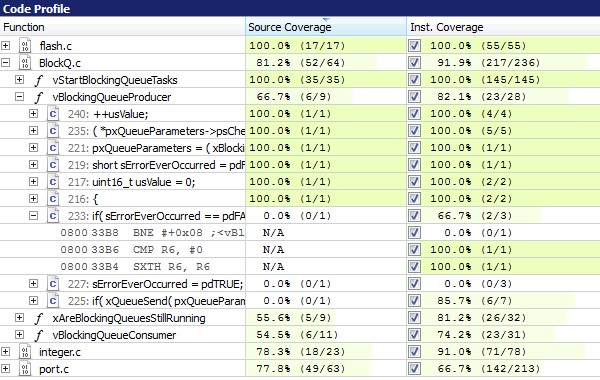
3. Zero-overhead code coverage measurement
More Info: https://www.segger.com/products/development-tools/ozone-j-link-debugger/technology/trace-features/
Disadvantages to Instruction Tracing
- Consumes pins (4 data and clock) that aren’t used in the final product
- Cost of J-Trace probe. This can be mitigated by sharing the J-Trace probe among firmware engineers. https://shop-us.segger.com/TraceProbe_s/41.htm
- Up front cost of board space and design time. Tracing signals require tight constraints on wire lengths and termination resistors. Fortunately, required components can be surface mount and no-loaded to save cost. Parts may be post-loaded to debug issues, if needed. More details on board design in the following document: https://www.segger.com/downloads/jlink/UM08001
- Off-the-shelf evaluation boards that include instruction trace often cost more
- Instruction tracing (even over a few seconds) can generate gigabyte instruction listings that are time consuming to parse through. Licensed debugging software (such as Keil and IAR) often contain much better trace analysis tools than the free Ozone software.
Basic Debug Strategy with Instruction Trace
The most common strategy for debugging with instruction trace involves triggering a breakpoint during a failing condition, running the code up to that breakpoint, and using instruction trace to observe the sequence of code that caused it. Adjust your system parameters (such as minimizing timeouts or queue sizes) to reduce the time between the failing condition and the breakpoint, if possible.
The following list describes some example scenarios and ways to trigger the breakpoint:
Process taking too little or too much time:
Read a microsecond timer and calculate the duration or interval between loops. Trigger a breakpoint if the duration falls outside expected timing bounds.
Periodic processes getting the wrong number of events between runs:
Trigger a breakpoint when the number of events (such as interrupt) is outside of expected bounds.
Watchdog times out:
Set a breakpoint near the top of the reset handler, run the code that triggers the watchdog and observe the sequence just before the reset. An extensive loop or wait without a timeout condition is often the culprit.
Memory Fault:
Set a breakpoint in the hard-fault handler and observe the code that leads up to it.
Data corruption:
If a variable or memory location changes to an invalid value, trigger a breakpoint when the value becomes invalid. You can also use the ARM hardware breakpoints to trigger when a specific memory location changes.
Code Hangs where the watchdog doesn’t time out:
Turn on the tracing feature, run the code until it hangs and then press the “pause” or “halt” button in the debugger to look at the code trace.
Interactions with MCU peripherals:
Instrument your interrupt handlers to read relevant peripheral registers. Trigger a breakpoint if unexpected values are detected.
Interactions with external hardware:
Add a GPIO interrupt handler that fires when external hardware misbehaves. Set a breakpoint in the GPIO handler to stop the CPU and get the instruction trace.


